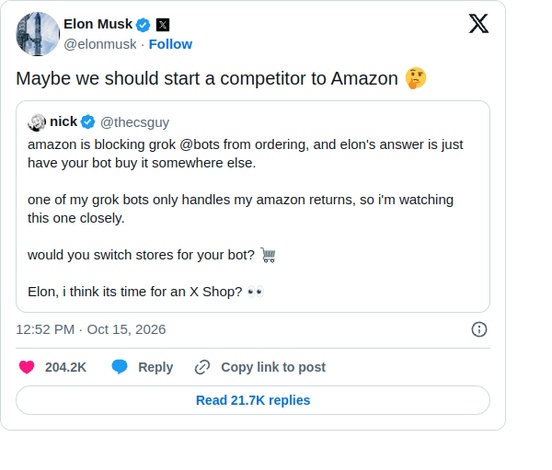
Amazon's shopping assistant users spend 50% more per order: why that number doesn't measure what the tool does
 Alexandre Suon·7 min read·
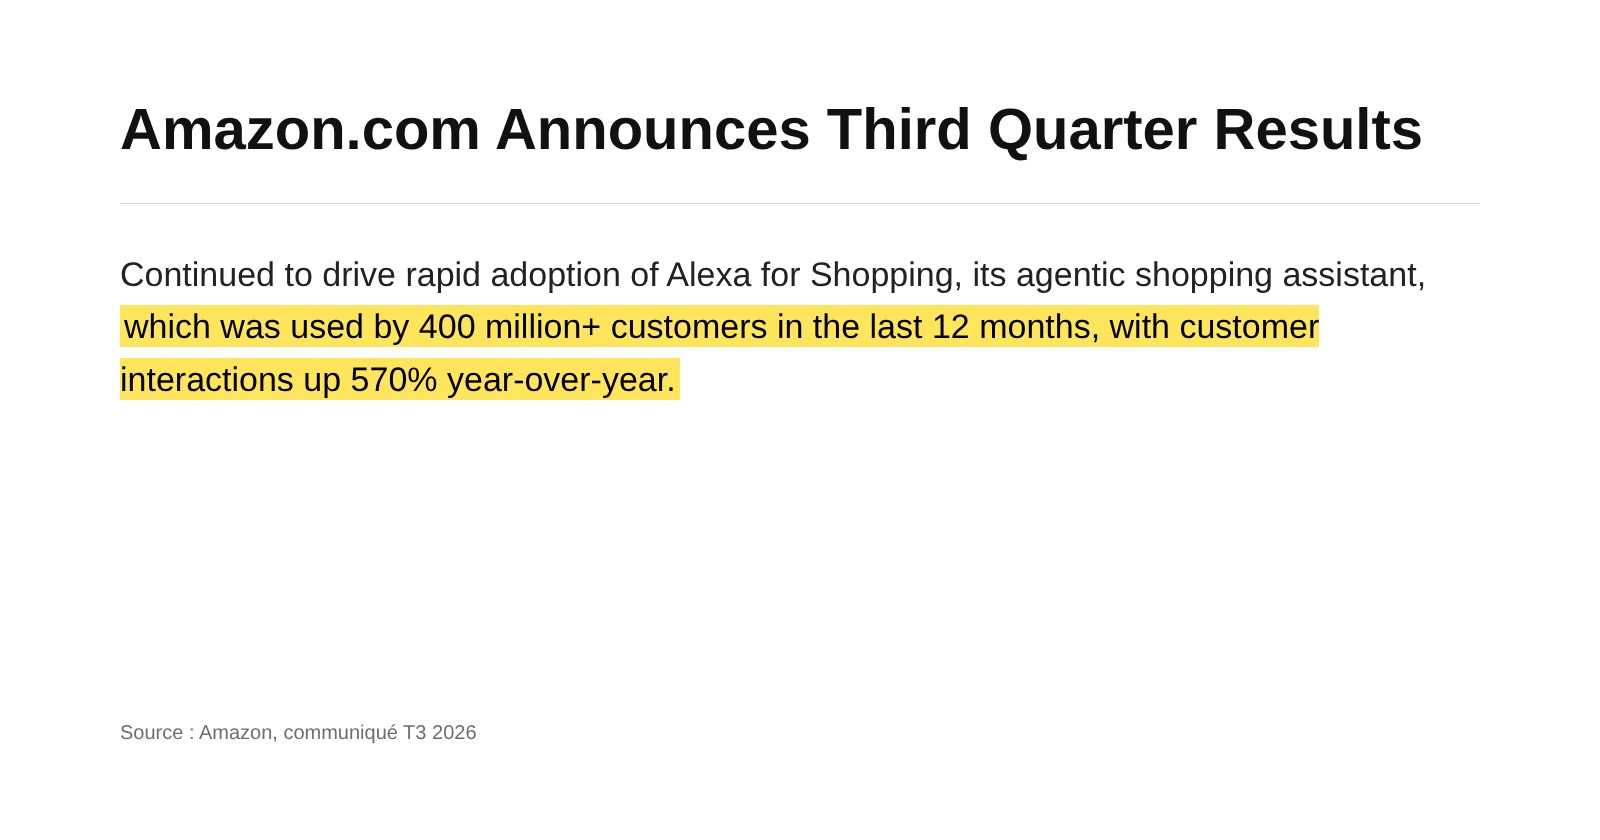
Amazon reports more than 400 million users for its shopping assistant, and 50% bigger orders among those who use it. That number will travel to a lot of board meetings. What it says, what it doesn't, and how to measure the real effect of an assistant or feature on your own site.
In this articleShow all sectionsHide
30-second summary
ShowHide ⌄
- On October 29, 2026, Amazon said its shopping assistant, Alexa for Shopping, was used by more than 400 million customers in the last 12 months, with customer interactions up 570% year over year.
- On the earnings call, Andy Jassy added that U.S. customers using it spend 50% more per order than those who don't.
- That number compares two different audiences. Customers who open a shopping assistant tend to be the most engaged ones: they may well have spent more already.
- The same shortcut shows up on most sites: "site search users convert much better". It measures purchase intent, not the feature's effect.
- Only a test, with part of the traffic exposed and part not, measures the real effect. The right metric is revenue per visitor, not per user.
Section 1 · The announcement
400 million users in 12 months, and 50% bigger orders
With its third-quarter results, released on October 29, 2026, Amazon put its shopping assistant front and center. Alexa for Shopping, which took over from Rufus in May, was used by more than 400 million customers over the last 12 months. Customer interactions with the assistant were up 570% year over year.
On the analyst call, Andy Jassy gave one more number: U.S. customers using Alexa for Shopping are spending 50% more per order than those who don't. Amazon published no calculation method, no order count and no adjustment for product category or customer type.
What the number compares Two groups of U.S. customers: those who used the assistant and those who didn't. Their average order value is compared. Nothing says the two groups looked alike beforehand, or that the assistant caused the gap.
Section 2 · The trap
Comparing users with non-users first measures a difference between two audiences
The assistant may work very well. This number alone can't show it. The problem lies in how the two groups form: nobody randomly decided who would use the assistant. Customers chose for themselves.
- Who opens a shopping assistant? Often engaged customers, who compare, ask questions and prepare a big purchase.
- They may have spent more already. A customer planning to buy a TV asks more questions than one reordering coffee.
- The arrow can point the other way. A big basket prompts research, so assistant use. The assistant didn't grow the basket.
| Reading | What it assumes | What it would take to check |
|---|---|---|
| The assistant makes people spend more | Both groups were comparable before using the assistant | A test: randomly assigned groups, one with the assistant, one without |
| Big spenders use the assistant | Users already spent more before | Compare the same customers' orders before and after, or a test |
“Comparing people who use a tool with people who don't measures who chooses to use it. Not what it produces.”
Section 3 · On your site
The same shortcut hides in most e-commerce dashboards
This reasoning isn't unique to Amazon. It shows up in many teams' quarterly reviews: users of site search, chat, the configurator or the wishlist "convert much better".
Of course they do: they came to buy. A visitor who types a product reference into site search already has a purchase intent that a visitor landing on the homepage from an ad doesn't. The feature is often a sign of intent, not its cause.
Selection bias When members of a group choose themselves, the differences measured between that group and the rest first reflect whatever made them choose. It's the most common bias in feature analysis, and it almost always flatters the feature.
The risk is concrete. A team can invest in a tool on the strength of this kind of number, push it higher in the journey, and see no effect on total revenue. Or, the other way round, remove a feature that "only 3% of visitors use" without seeing that it carried orders.
Section 4 · The test
Only a test measures the real effect: part of the traffic with the tool, part without
To know what an assistant or a feature brings in, chance has to decide who gets access. Visitors are split into two comparable groups, one gets the tool and the other doesn't, and you compare the results of both groups as a whole, users or not.
- 1Split visitors at randomFor example 90% with the feature, 10% without (holdout group). The split happens on arrival, before any behavior.
- 2Pick a per-visitor metricRevenue per visitor, across all visitors in each group. Not the order value of users alone.
- 3Set the duration up frontCompute the sample size needed, cover at least two weekly cycles, and don't stop at the first good-looking result.
- 4Read the gap between the two groupsThat is the feature's effect. It is often far smaller than the gap between users and non-users.
Why per visitor, not per user Keeping only the tool's users in the exposed group brings selection bias straight back. Comparing all visitors in both groups measures what the tool changes for the whole site, including for people who never use it.
Section 5 · What to ask
Three questions to ask when shown a "users of X convert better" number
- Were the two groups formed at random, or did customers choose to use the feature themselves?
- Does the metric cover every visitor in each group, or only those who used the tool?
- What has total site revenue done since the feature launched, and is there a holdout group to compare it with?
If the answer to the first question is "they chose", the number describes an audience. It can help frame a hypothesis, never put a figure on return on investment.
Key terms
ShowHide ⌄
- Correlation
- Two things that move together. Assistant users spend more: that's a correlation. It doesn't say which causes which.
- Causation
- One change actually producing another. Establishing it on a site takes a test where chance decides who is exposed.
- Selection bias
- The error that appears when group members choose themselves: measured gaps reflect whatever made them choose.
- Holdout group
- A randomly drawn share of traffic that doesn't get the feature being tested. It serves as the point of comparison.
- Revenue per visitor
- A group's revenue divided by all its visitors, buyers or not. It combines conversion rate and average order value.
Sources
ShowHide ⌄
Alexandre co-founded and runs Henkan & Partners. He decodes one e-commerce story every day on LinkedIn.
Follow Alexandre ↗